Environmental Impact
Detailed carbon footprint analysis, water usage comparisons, landfill diversion statistics, and lifecycle assessment data for IBC containers.
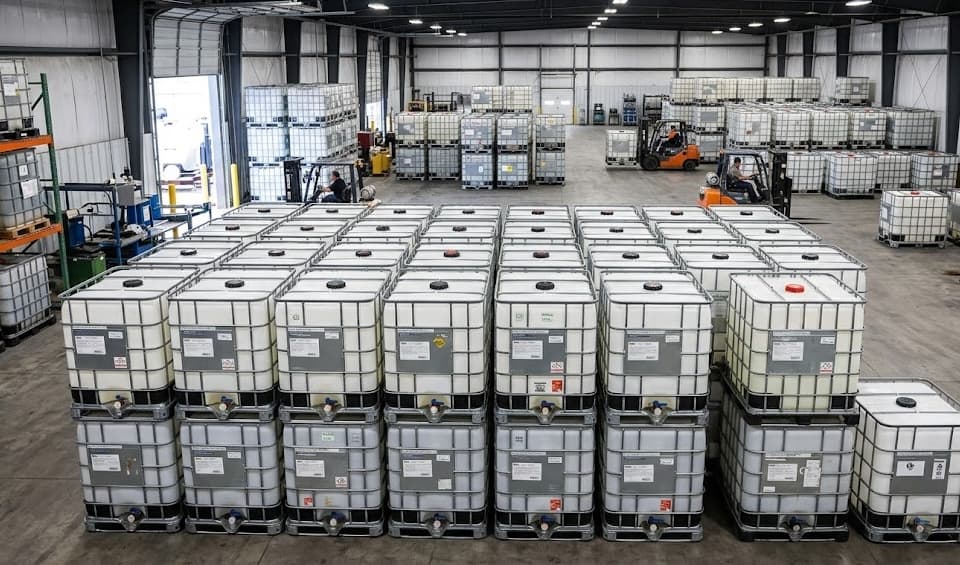
Every IBC container represents a significant investment of raw materials, energy, and water. When businesses choose to reuse, recondition, or recycle IBCs instead of sending them to landfills, the environmental benefits are substantial and measurable. At IBC Cincinnati, headquartered at 1405 Worldwide Blvd, Hebron, KY 41048, sustainability is not just a marketing message — it is the foundation of our business model. This page presents the data behind our commitment to the circular economy.
Less energy to recondition an IBC than to manufacture a new one
Reduction in carbon emissions per container through reconditioning
Less water used in reconditioning vs. new HDPE production
Number of times an IBC can be reused before end-of-life recycling
Carbon Footprint Analysis
Manufacturing a single new 275-gallon composite IBC from raw materials generates an estimated 180 kg (397 lbs) of CO2 equivalent emissions. This figure accounts for HDPE resin production from petroleum feedstock, steel cage fabrication, wood pallet harvesting and processing, blow-molding energy consumption, and transportation of raw materials to the manufacturing facility.
By contrast, reconditioning an existing IBC generates approximately 35-55 kg (77-121 lbs) of CO2 equivalent — a reduction of 70-80%. The reconditioning process involves cleaning (triple-wash), inspection, minor repairs, gasket and valve replacement, and re-labeling. Even accounting for the energy and water used in cleaning, the carbon savings are dramatic.
| Process Stage | New IBC (kg CO2e) | Reconditioned (kg CO2e) | Savings |
|---|---|---|---|
| Raw material extraction | 62 kg | 0 kg | 100% |
| HDPE resin production | 48 kg | 0 kg | 100% |
| Steel cage fabrication | 35 kg | 2 kg (repairs) | 94% |
| Blow-molding / assembly | 18 kg | 0 kg | 100% |
| Cleaning / reconditioning | 0 kg | 28 kg | N/A |
| Pallet production | 12 kg | 3 kg (repair/replace) | 75% |
| Transportation (avg) | 5 kg | 12 kg (collection + delivery) | -140% |
| TOTAL | 180 kg | 45 kg | 75% |
Water Usage: Manufacturing vs. Reconditioning
Water consumption is a critical and often overlooked environmental factor in the IBC lifecycle. Manufacturing a new HDPE composite IBC requires approximately 1,200 liters (317 gallons) of water when you account for petroleum extraction cooling, HDPE resin processing, blow-molding cooling systems, and steel production water requirements.
Reconditioning an IBC uses approximately 150-200 liters (40-53 gallons) of water per unit for the triple-wash cleaning process. This represents an 83-87% reduction in water consumption. At IBC Cincinnati, we further reduce this impact by operating a closed-loop water treatment system that recycles approximately 60% of our wash water, bringing our effective water usage down to approximately 75 liters (20 gallons) per reconditioned unit.
Water for new IBC manufacturing
Water for IBC reconditioning (with recycling)
Landfill Diversion Statistics
An estimated 37 million IBC containers are in circulation in North America at any given time. Without reconditioning and recycling programs, the majority of these would end up in landfills after a single use. A single 275-gallon composite IBC contains approximately 15 kg (33 lbs) of HDPE plastic, 25 kg (55 lbs) of steel, and 10 kg (22 lbs) of wood — 50 kg (110 lbs) of material per container.
The IBC reconditioning and recycling industry diverts an estimated 500,000 tons of material from landfills annually in the US alone. At IBC Cincinnati, we process thousands of containers every year. Each container that we recondition for reuse represents 50 kg of material diverted from the waste stream. Each container that we recycle at end of life converts that 50 kg into valuable secondary raw materials instead of landfill waste.
HDPE plastic takes an estimated 450+ years to decompose in a landfill. By choosing to recondition or recycle your IBCs through IBC Cincinnati, you are preventing centuries of environmental impact with a single decision.
Recycling Processes
HDPE Bottle Recycling
When an IBC bottle reaches end of life, it is removed from the cage and fed through an industrial granulator that shreds it into small flakes. These flakes are washed, dried, and melted into HDPE pellets (resin code #2). The recycled pellets are sold to manufacturers who use them to produce drainage pipes, lumber alternatives, plastic containers, and other HDPE products. The recycling rate for IBC HDPE bottles is approximately 95% by weight — almost nothing is wasted.
Steel Cage Recycling
Steel cages are separated from the bottle and pallet, compressed with a baler, and sold to steel recycling facilities. The galvanized steel is melted in an electric arc furnace and reformed into new steel products. Steel is infinitely recyclable without any degradation in quality. The energy savings of recycling steel versus producing new steel from iron ore is approximately 74%, and the recycled steel retains 100% of its structural properties.
Wood Pallet Recycling
Wood pallets in good condition are repaired and reused. Damaged pallets are processed through a wood chipper and converted into mulch, animal bedding, particleboard, or biomass fuel. In some cases, the wood chips are composted. The goal is zero-waste: every component of the IBC is either reused, recycled, or repurposed. At IBC Cincinnati, we have achieved a 98% landfill diversion rate across all IBC components.
Lifecycle Assessment Summary
A complete lifecycle assessment (LCA) of an IBC container considers environmental impacts from cradle to grave: raw material extraction, manufacturing, transportation, use phase, reconditioning cycles, and end-of-life processing. Key findings from industry LCA studies include:
- 1.An IBC reused 5 times has a per-use carbon footprint that is 82% lower than a single-use container.
- 2.The transportation phase accounts for only 3-7% of total lifecycle emissions, making long-distance collection and redistribution environmentally worthwhile.
- 3.End-of-life recycling recovers 92-98% of the material value of an IBC, with steel having the highest recovery rate (99%) and wood the lowest (85%).
- 4.Switching from new IBCs to a 50/50 mix of reconditioned and new containers reduces a company's container-related carbon footprint by 35-40% with no compromise in performance for most applications.
- 5.The cumulative water savings of reconditioning 1,000 IBCs versus manufacturing 1,000 new ones equals approximately 1,125,000 liters (297,000 gallons) — enough to fill 4.5 Olympic swimming pools.
Carbon Calculator Methodology
The carbon footprint figures presented on this page are derived from a cradle-to-gate lifecycle assessment methodology consistent with ISO 14040/14044 standards. Here is how we calculate the environmental impact of each IBC in our supply chain:
Step 1: Material Inputs
We quantify the mass of each material component (HDPE resin, steel, wood, rubber, etc.) and apply emission factors from the Ecoinvent 3.8 database and US EPA Emission Factors Hub. HDPE resin production from crude oil emits approximately 3.0-3.5 kg CO2e per kg of resin. Steel production emits approximately 1.8-2.2 kg CO2e per kg from blast furnace operations.
Step 2: Manufacturing Energy
Blow-molding energy consumption averages 1.2-1.8 kWh per kg of HDPE processed. Cage welding and galvanizing add approximately 0.5-0.8 kWh per kg of steel. We apply grid-average emission factors for the manufacturing country (0.42 kg CO2e/kWh for US grid average).
Step 3: Transportation
Transportation emissions are calculated using average truck fuel consumption (6 MPG for Class 8 trucks) and diesel emission factors (10.21 kg CO2e per gallon). We assume an average one-way transport distance of 250 miles for new IBC delivery and 150 miles for reconditioned IBC collection and redistribution.
Step 4: Reconditioning Process
Reconditioning emissions include energy for heating wash water (natural gas or electric), water treatment, compressed air for drying, and minor repair operations. Our facility uses energy-efficient boilers and a closed-loop water recycling system that reduces both energy and water consumption by approximately 40% compared to industry averages.
Step 5: End-of-Life Credit
When IBCs are recycled at end of life, we apply substitution credits for the recycled materials. Recycled HDPE displaces virgin HDPE production, and recycled steel displaces virgin steel from iron ore. These credits reduce the net lifecycle carbon footprint by 15-25% when the full lifecycle is considered.
Pro Tip: Calculate Your Own Savings
To estimate your company's carbon savings from switching to reconditioned IBCs, multiply the number of containers you purchase annually by 135 kg CO2e (the average savings per container). For example, a company that buys 200 IBCs per year would save approximately 27 metric tons of CO2e annually — equivalent to removing 6 cars from the road. Contact IBC Cincinnati for a customized sustainability report based on your actual purchasing volume.
IBCs vs. Other Container Types
IBCs are not the only option for bulk liquid transport and storage. Understanding how their environmental footprint compares to alternatives helps you make the most sustainable choice for your specific application.
| Container Type | Typical Volume | CO2e per Gallon Transported | Reusability | Recyclability | Overall Environmental Score |
|---|---|---|---|---|---|
| IBC tote (reconditioned) | 275-550 gal | 0.12 kg | 5-8 cycles | 95-98% | Excellent |
| IBC tote (new, single use) | 275-550 gal | 0.65 kg | 1 cycle (if not reconditioned) | 95-98% | Moderate |
| 55-gallon steel drums | 55 gal | 0.95 kg | 2-3 cycles (reconditioned) | 99% (steel) | Moderate |
| Flexitank (in shipping container) | 4,000-6,300 gal | 0.08 kg | Single use | 30-50% (PE film) | Mixed |
| ISO tank container | 5,000-6,300 gal | 0.05 kg | 20+ years | 99% (steel) | Excellent (for large volumes) |
| Plastic drums (HDPE) | 15-55 gal | 1.20 kg | 1-3 cycles | 85-90% | Below average |
For volumes between 200-600 gallons, reconditioned IBC totes offer the best balance of environmental performance, cost, and practicality. For larger volumes (4,000+ gallons), flexitanks and ISO tanks may be more efficient but require specialized handling infrastructure. For more guidance on choosing the right container for your needs, visit our Buying Guide.
Water Footprint Deep Dive
Water is used at multiple stages of the IBC lifecycle. Understanding the full water footprint — from raw material extraction through manufacturing and reconditioning — reveals just how significant the water savings from IBC reuse truly are.
| Process Stage | New IBC (Liters) | Reconditioned (Liters) | Water Savings |
|---|---|---|---|
| Petroleum extraction cooling | 320 L | 0 L | 100% |
| HDPE resin polymerization | 280 L | 0 L | 100% |
| Blow-molding cooling | 180 L | 0 L | 100% |
| Steel production | 350 L | 5 L (repairs) | 99% |
| Cleaning / reconditioning | 0 L | 75 L (with water recycling) | N/A |
| Galvanizing | 70 L | 0 L | 100% |
| TOTAL | 1,200 L (317 gal) | 80 L (21 gal) | 93% |
Did You Know?
The water savings from reconditioning just 10 IBCs (instead of manufacturing 10 new ones) equals approximately 11,200 liters (2,960 gallons) — enough to supply an average American household's indoor water needs for nearly 10 days. Over a year, a company reconditioning 500 IBCs saves enough water to fill a 25-meter swimming pool. These water savings are especially significant in drought-prone regions where water conservation is a regulatory and ethical priority.
Environmental Certifications Explained
Several environmental certifications and standards are relevant to IBC manufacturing, reconditioning, and recycling. Understanding these certifications helps you evaluate suppliers and verify their sustainability claims.
ISO 14001 — Environmental Management
The international standard for Environmental Management Systems (EMS). ISO 14001 certification demonstrates that a company has implemented systematic processes to monitor and reduce its environmental impact, comply with environmental regulations, and continually improve its environmental performance. Many major IBC manufacturers and reconditioners hold ISO 14001 certification.
R2 (Responsible Recycling)
Originally developed for electronics recycling, the R2 standard is increasingly being adapted for industrial container recycling. R2-certified recyclers must demonstrate responsible downstream material management, worker health and safety practices, and environmental compliance throughout the recycling process.
ISCC Plus — Circular Economy Certification
The International Sustainability and Carbon Certification (ISCC) Plus standard provides a chain-of-custody framework for recycled and bio-based materials. ISCC Plus certification can verify that recycled HDPE from IBC bottles meets traceability and sustainability requirements for use in new products, including food-contact packaging.
SCS Recycled Content Certification
SCS Global Services provides third-party certification of recycled content claims. An IBC manufacturer with SCS certification can verify the exact percentage of post-consumer or post-industrial recycled content in their products. This certification is increasingly requested by customers with corporate sustainability goals and ESG reporting requirements.
Cradle to Cradle (C2C) Certified
The Cradle to Cradle Certified standard evaluates products across five categories: material health, material reutilization, renewable energy, water stewardship, and social fairness. While few IBC products have achieved full C2C certification to date, the framework is gaining traction in the packaging industry as a comprehensive sustainability benchmark.
EPA Safer Choice
While this certification applies to cleaning products rather than containers, it is relevant to the IBC reconditioning process. IBC reconditioners who use EPA Safer Choice certified cleaning agents in their triple-wash process can demonstrate that their cleaning chemicals meet EPA standards for human health and environmental safety.
Environmental FAQ
Can I include IBC reconditioning in my company's ESG report?+
What happens to the wash water from IBC reconditioning?+
Are there tax incentives for using reconditioned containers?+
How does IBC plastic recycling compare to curbside plastic recycling?+
What is the environmental impact of IBC transportation for reconditioning?+
Make the Sustainable Choice
Every IBC you recondition or recycle through IBC Cincinnati reduces your environmental footprint. Contact us to learn how we can help your business achieve its sustainability goals while saving money.